
After the Fires: Pacific Palisades Home Sales & Market Update

The Pacific Palisades real estate market has seen a steady recovery since the fires, especially in the burn zones. Here’s an in-depth look.
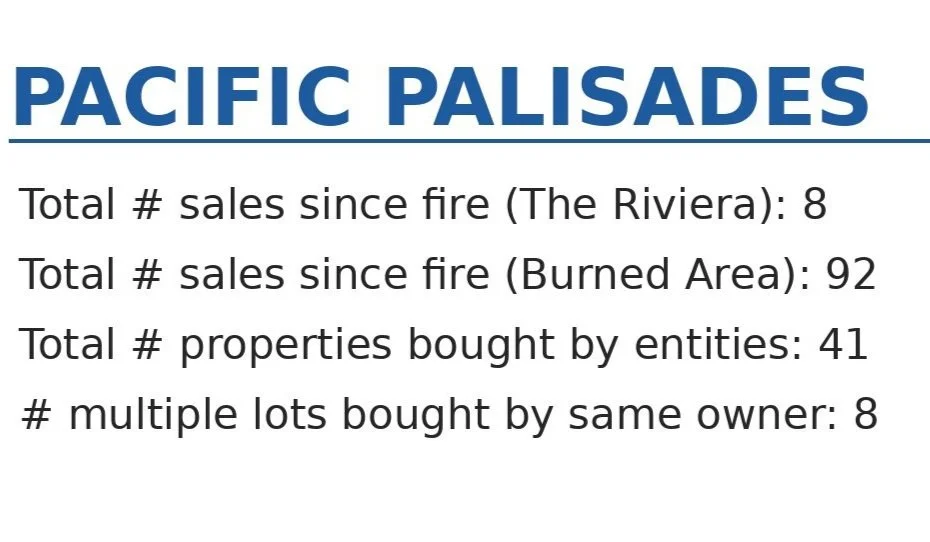
June Snapshot: Strongest Since the Fires
• 32 lots sold in June alone — the highest monthly volume since the Palisades fires.
• Included several adjacent parcels purchased by the same family or entity—indicative of assembly or estate-scale intentions.
Market Comparables & Trends
Median sale price in June: ~$3.05 M — down ~7.7% from last year Beach Cities Real Estate+14Redfin+14Los Angeles Times+14The Washington Post+1James Respondek+1Reddit+7Beach Cities Real Estate+7Realtor+7.
Zip 90272 shows a median list price of ~$1.65 M, down 7.1% YoY The Washington Post+14Rocket Mortgage+14Redfin+14.
Source: Fidelity Title
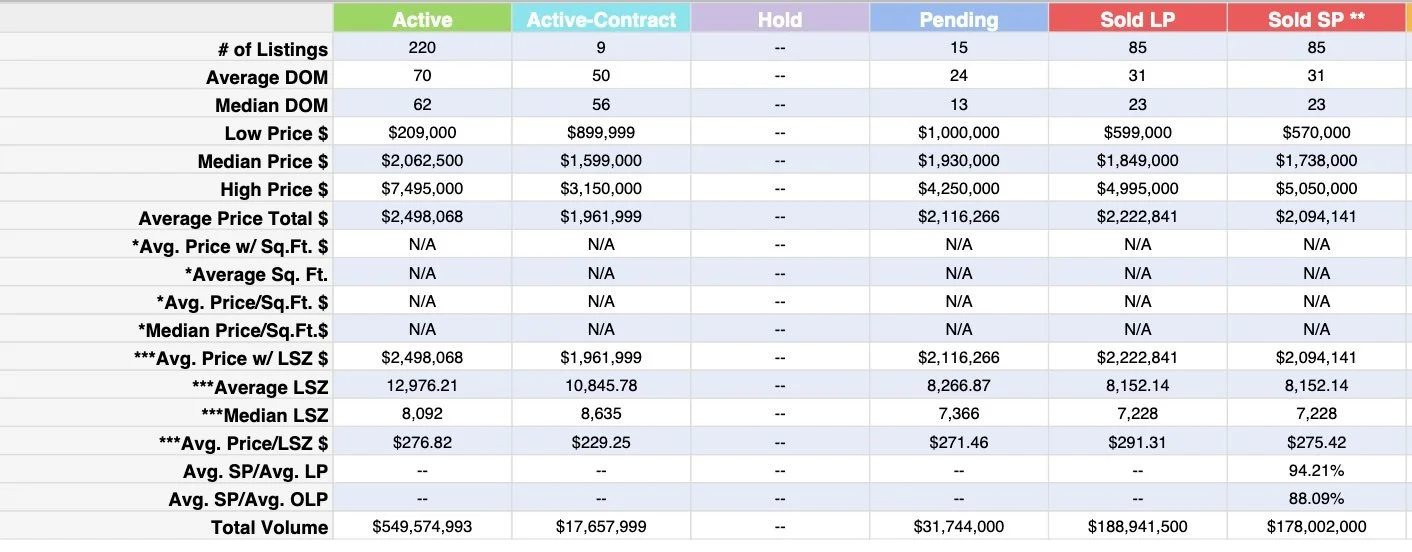
CURRENT Lot Listings & ESCROWS
As of June 30, there are:
214 land parcels currently listed for sale
Prices range from $749,000 to $7,495,000, the latter for a 33,206-square-foot lot on Alcima Road
Only 24 parcels are currently in escrow, reflecting buyer hesitancy amid permitting challenges and long timelines
Source: MLS
Rebuilding & Investor Activity
• Many entity buyers and single-entity multiple-lot acquisitions suggest intentions for large-scale redevelopment
• Over 49 burned lots have been listed across Palisades, signaling a growing rebuild opportunity
• A mix of end users and strategic investors continues to shape market dynamics
Visualizing the Market
Refer to included map overlays showing burned zones, Riviera vs. hillside areas, and June lot sales.
For Buyers & Investors
• June’s higher transaction volume reflects cautious optimism and tactical buying in a constrained market
• Median sales around $3M with tight inventory suggests select rebuild opportunities
• Watch for adjacent lot assemblies, burned-lot rebuilds, and new listings in micro-markets (Riviera, El Medio, Marquez)
Next Steps
• Provide links to active listings in Riviera and burned areas
• Include market comparisons and rebuilt comps for newly constructed homes
• Support mapping with sold-lot cluster overlays for planning visuals